pyscan
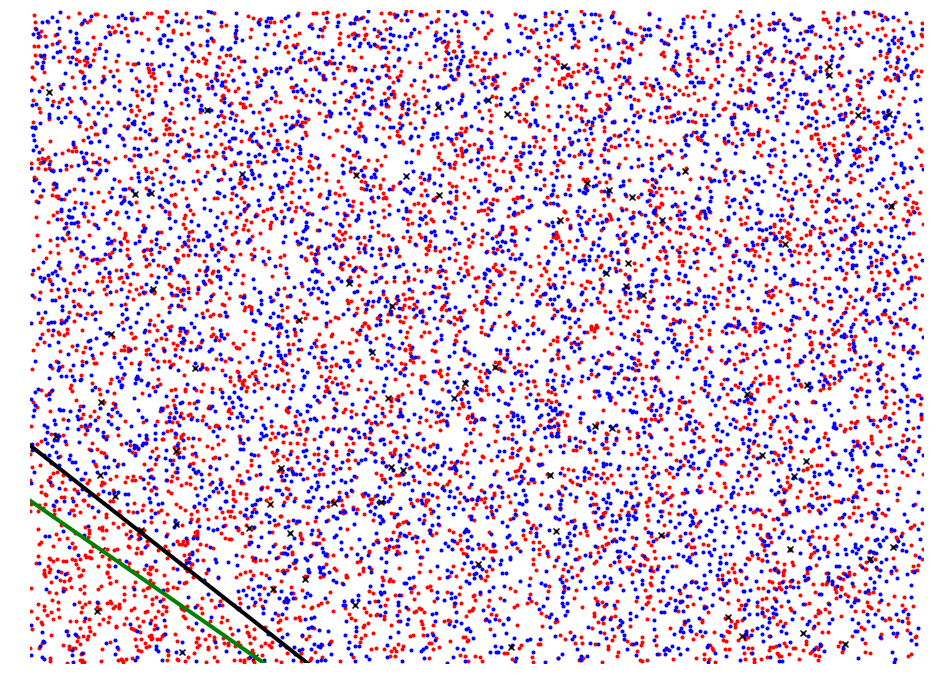
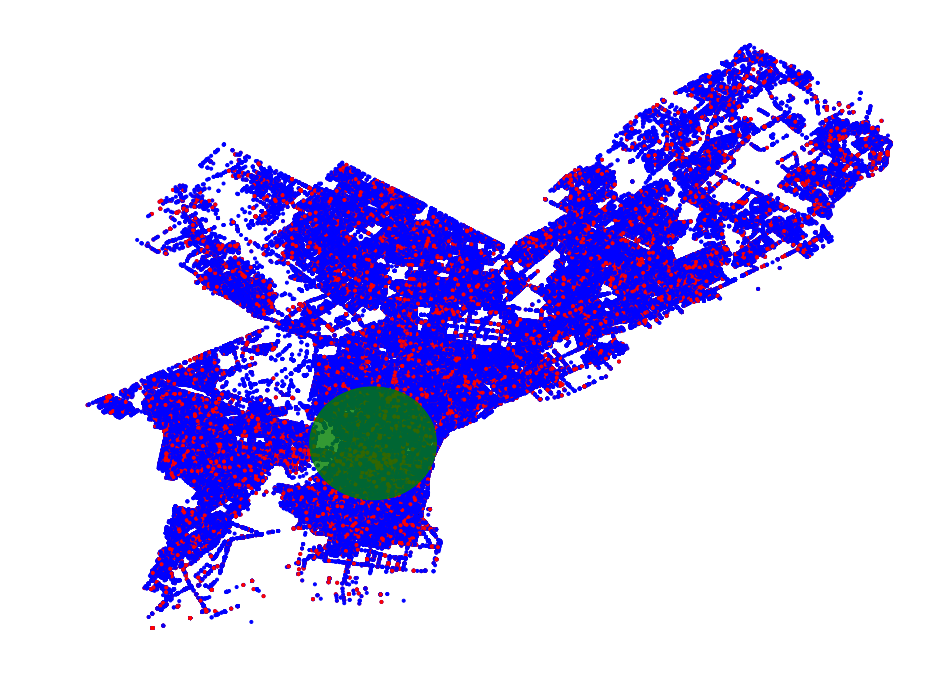
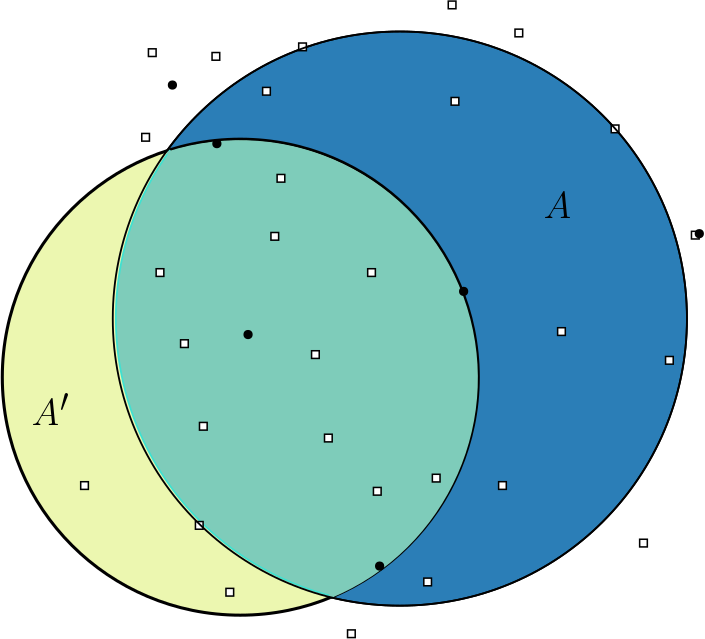
Spatial Scan Statistics provide a rigorous framework in which to define anomalies. This family of algorithms scan a set of defined regions over two, or possibly more sets of objects and attempt to maximize a function where the sets of objects have the largest disagreement. For instance given a red and blue set of points in 2d we might try to find a disk where the fraction of red points is as large as possible in comparison with the fraction of blue points.
Usually the maximized function is the Kulldorf Scan Statistic, \(\phi(m, b) = m \log m / b + (1 - m) \log (1 - m) / (1 - b)\), which is derived by assuming that there is a measured set of data \(M\) that follows a Poisson distribution with respect to a baseline set of data \(B\) [Kul97]. There are other statistics as well derived by assuming Gamma, Bernoulli, or Gaussian distributions.
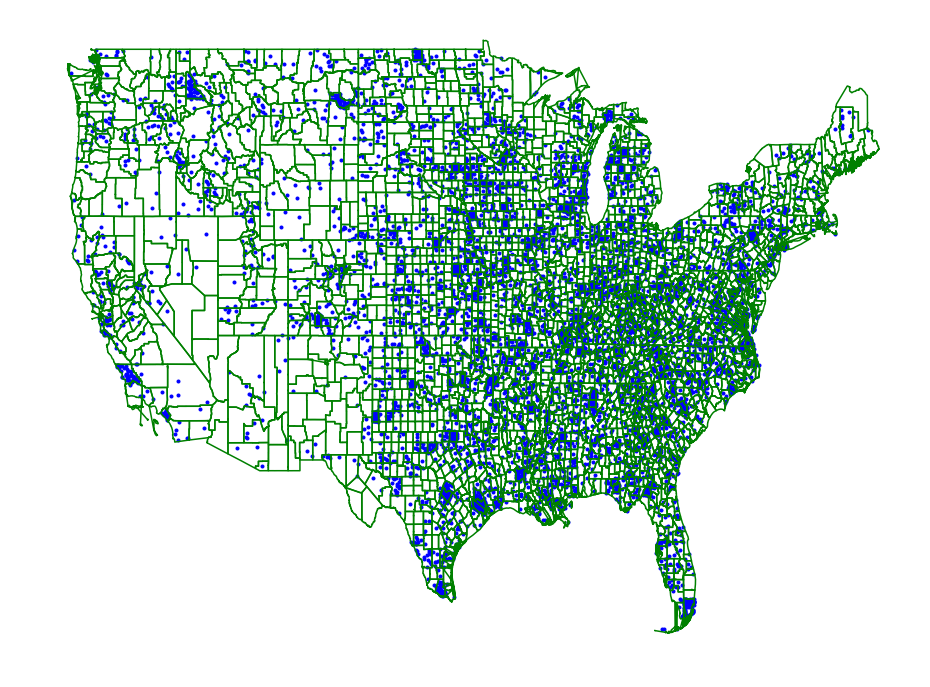
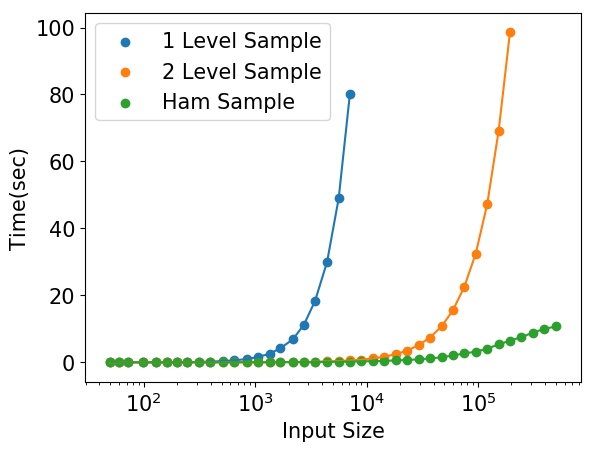
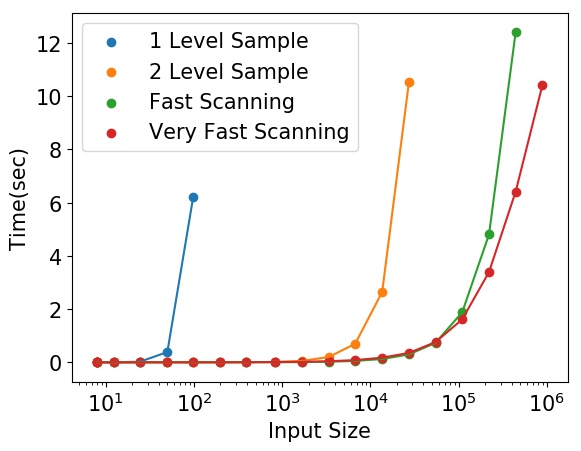
Most current software available for region based spatial scan statistics use exact algorithms which have scaling issues when applied to modern datasets. Pyscan provides a way to significantly increase the scale at which these methods can be run at while providing real guarantees on the accuracy and power of the anomalies found. The code is under active development and has been written about in a number of publications [MP18b][MP18a][MSZ+16]. Pyscan can scan regions defined by halfplanes, disks, and rectangles on point sets and trajectories and can be adapted to work in other related domains such as data sets aggregated to regions. All of these methods can be run at very large scales.
Our code is currently hosted on github at https://github.com/michaelmathen/pyscan.git.
Halfplane Scanning
Rectangle Scanning
 pyscan
1.0
pyscan
1.0